
On-Chain Analysis of Bitcoin
At the beginning of 2023, Bitcoin was trading at very low volatility levels. Realized volatility in December 2022 had declined to multi-year lows of 24.6%, with very few instances with similar levels. Historically, these periods usually precede those of much higher volatility environments, with most of them spurring higher prices, and indeed just one (Nov 2018) trading dramatically lower. Following an explosive month of volatile price action, Bitcoin is now consolidating above the on-chain cost basis of several cohorts. Despite a -6.2% pullback to a weekly low of $22.6k, the average BTC holder is now holding an unrealized profit, with several macro scale on-chain indicators suggesting turning off the market tides is potentially underway. There are several on-chain indicators one could use to analyze investor sentiment, and we will look at a few of the crucial ones.
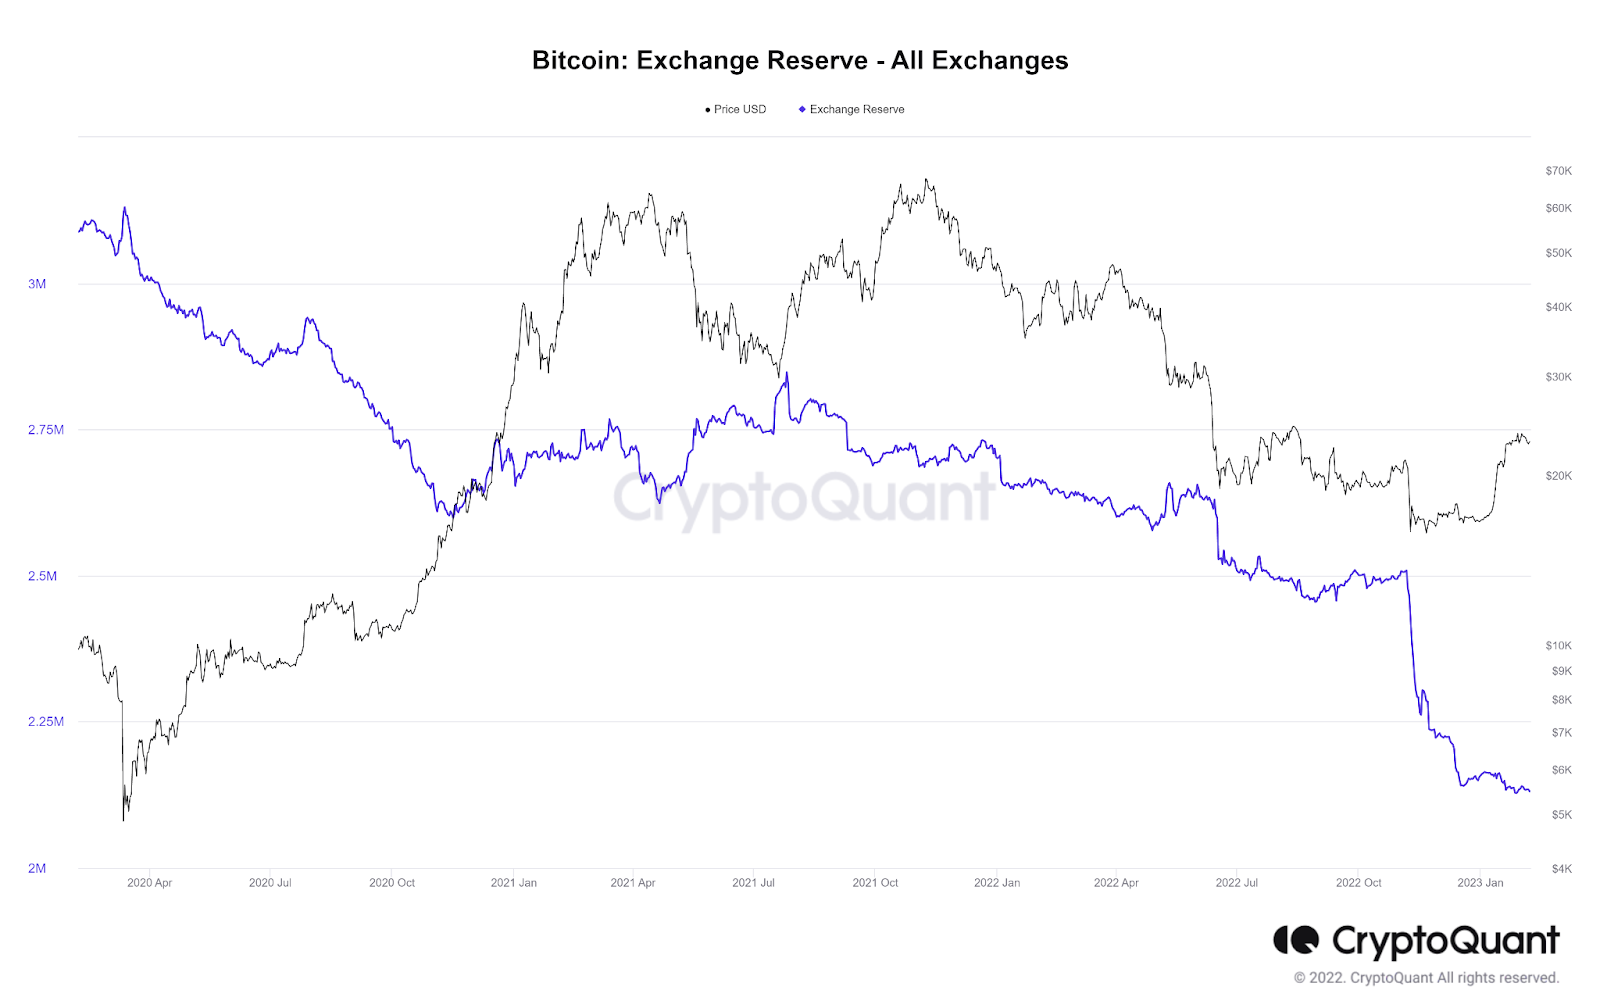
Exchange Reserve
A very high percentage of Bitcoin investors trade on centralized exchanges. They send in when they want to sell and send out when they have bought and want to hold. Tracking the inflows and outflows of Bitcoin to and fro exchanges informs us on investor sentiment and conviction. Therefore, it is an important on-chain metric to keep an eye on. Exchange reserve is at an all-time low of 2.1 million BTC, down 22% since the all-time high price of $69,000. That means that investors are indeed buying and accumulating for the long term.
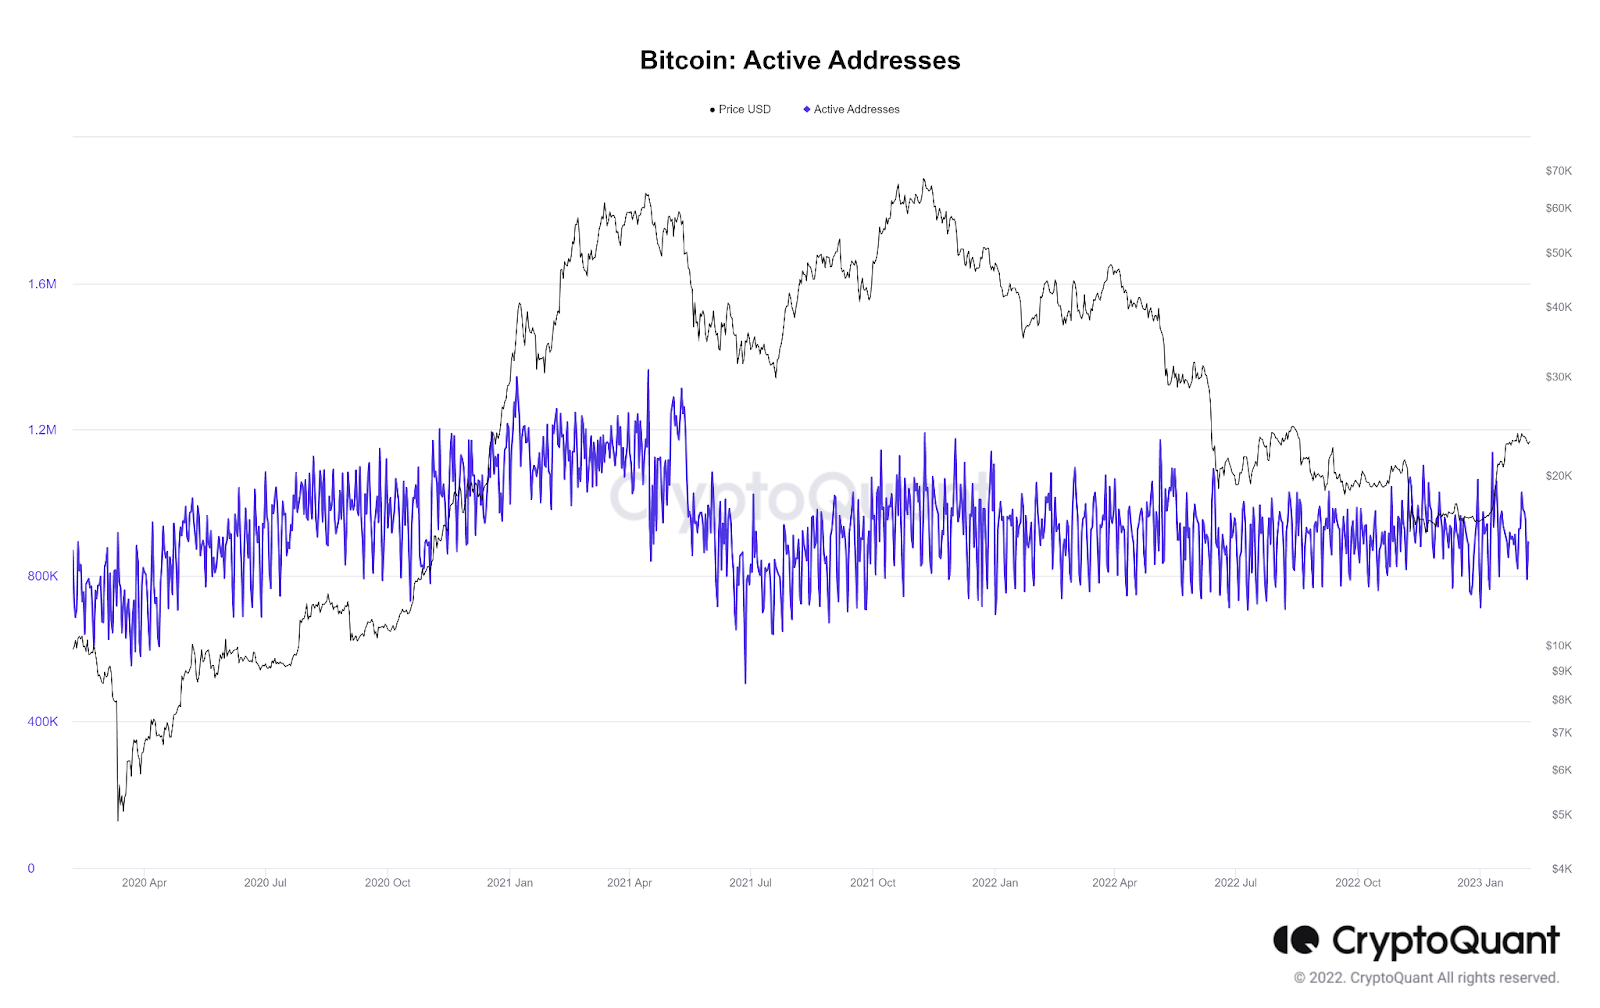
Active Addresses
The number of addresses that completed a transaction within a given period hints at how much activity the blockchain had during that time. According to Cryptoquant, an on-chain analysis service, the number of active addresses on the blockchain has stabilized from 800,000 to 1,000,000 since dipping to 500,000 in June 2021. That implies that most investors have not gone away, and we can juxtapose this metric with that of non-zero wallet addresses.
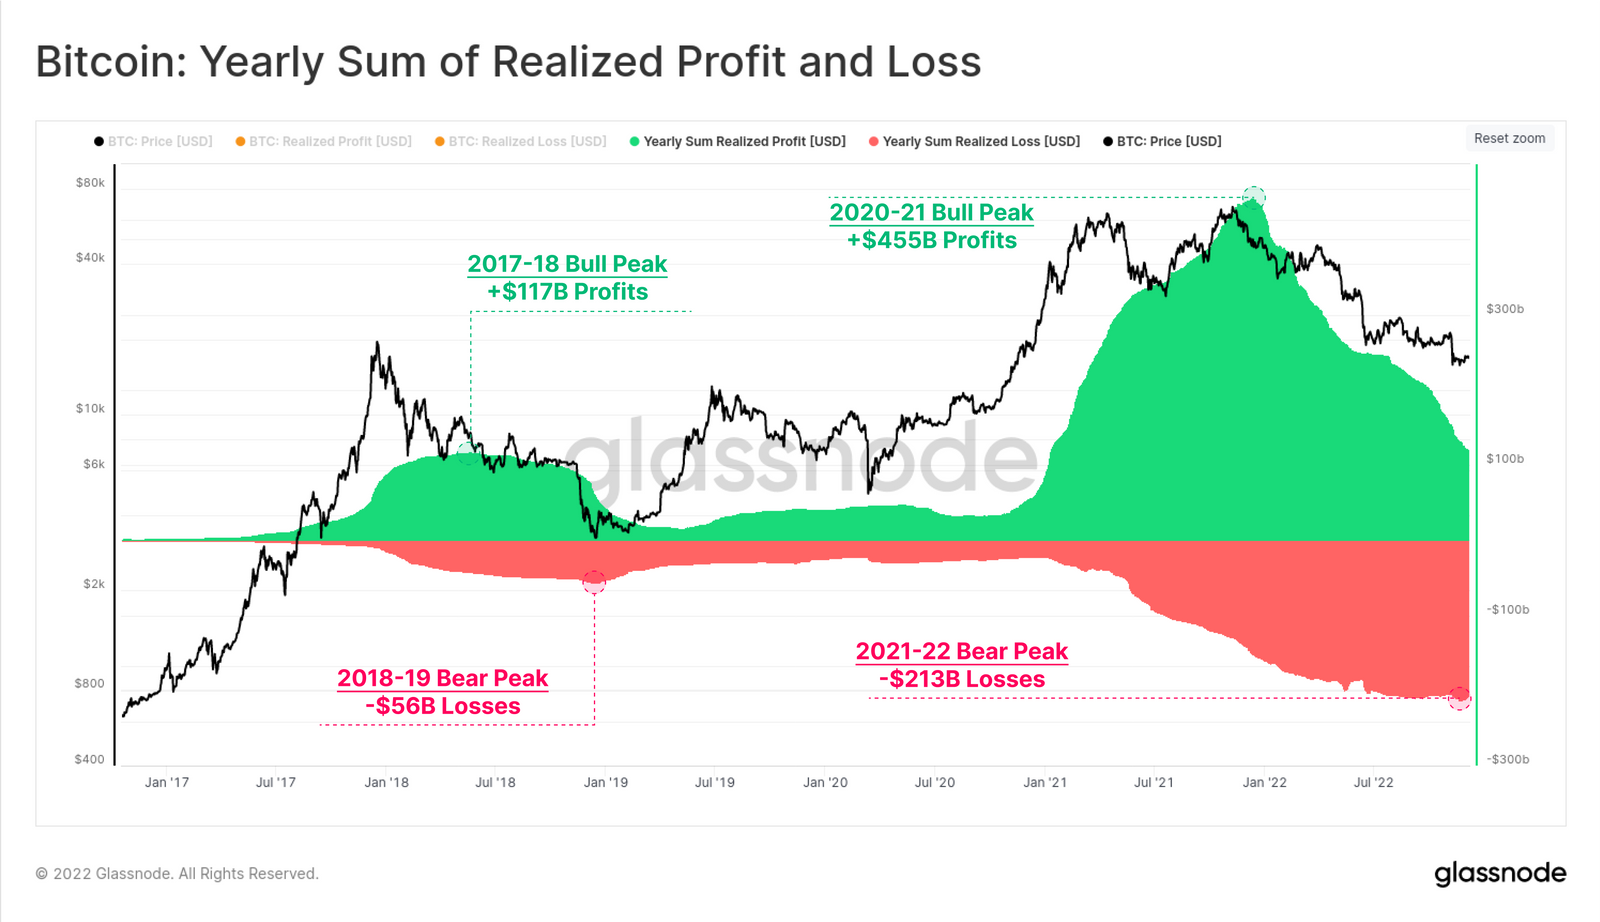
Yearly Sum of Realized Profit
The excess liquidity bubble from the loose monetary policy era in 2020-21 created a record yearly total realized profit on-chain in 2021. Over $455 billion in yearly profits were taken by Bitcoin investors moving funds on-chain soon after the November 2021 all-time high.
After then, a bear market regime dominated, and within that period, the market gave back over $213 billion in realized losses. That equates to 46.8% of the 2020-21 bull profits, which is very similar in magnitude to the 2018 bear markets, where the market gave back 47.9%. Usually, this forms a long-term bottom.
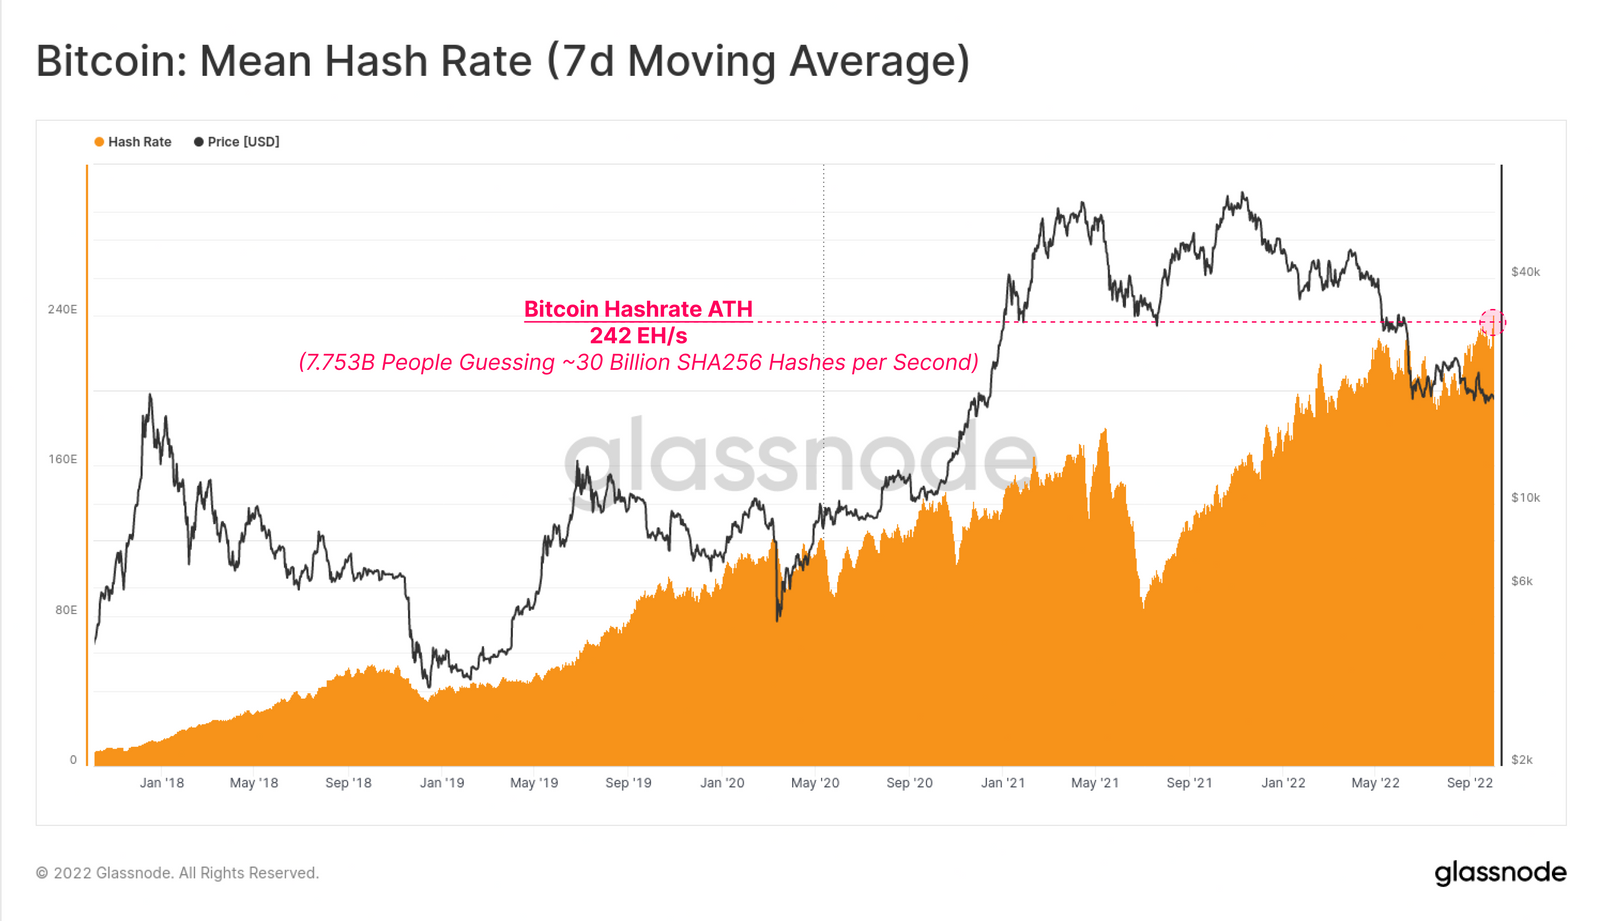
Mean Hash Rate
As the bear market raged on in 2022 and despite the Great Miner Migration in 2021, the Bitcoin hash rate reached a new all-time high of 242 exahash per second in October. To give an analogy for scale, this is equivalent to all 7.753 Billion people on earth, each completing an SHA-256 hash calculation approximately 30 Billion times every second. These are extraordinarily large numbers with bullish inclinations and go on to tell us how interested people have become in making direct investments into the security of the blockchain.
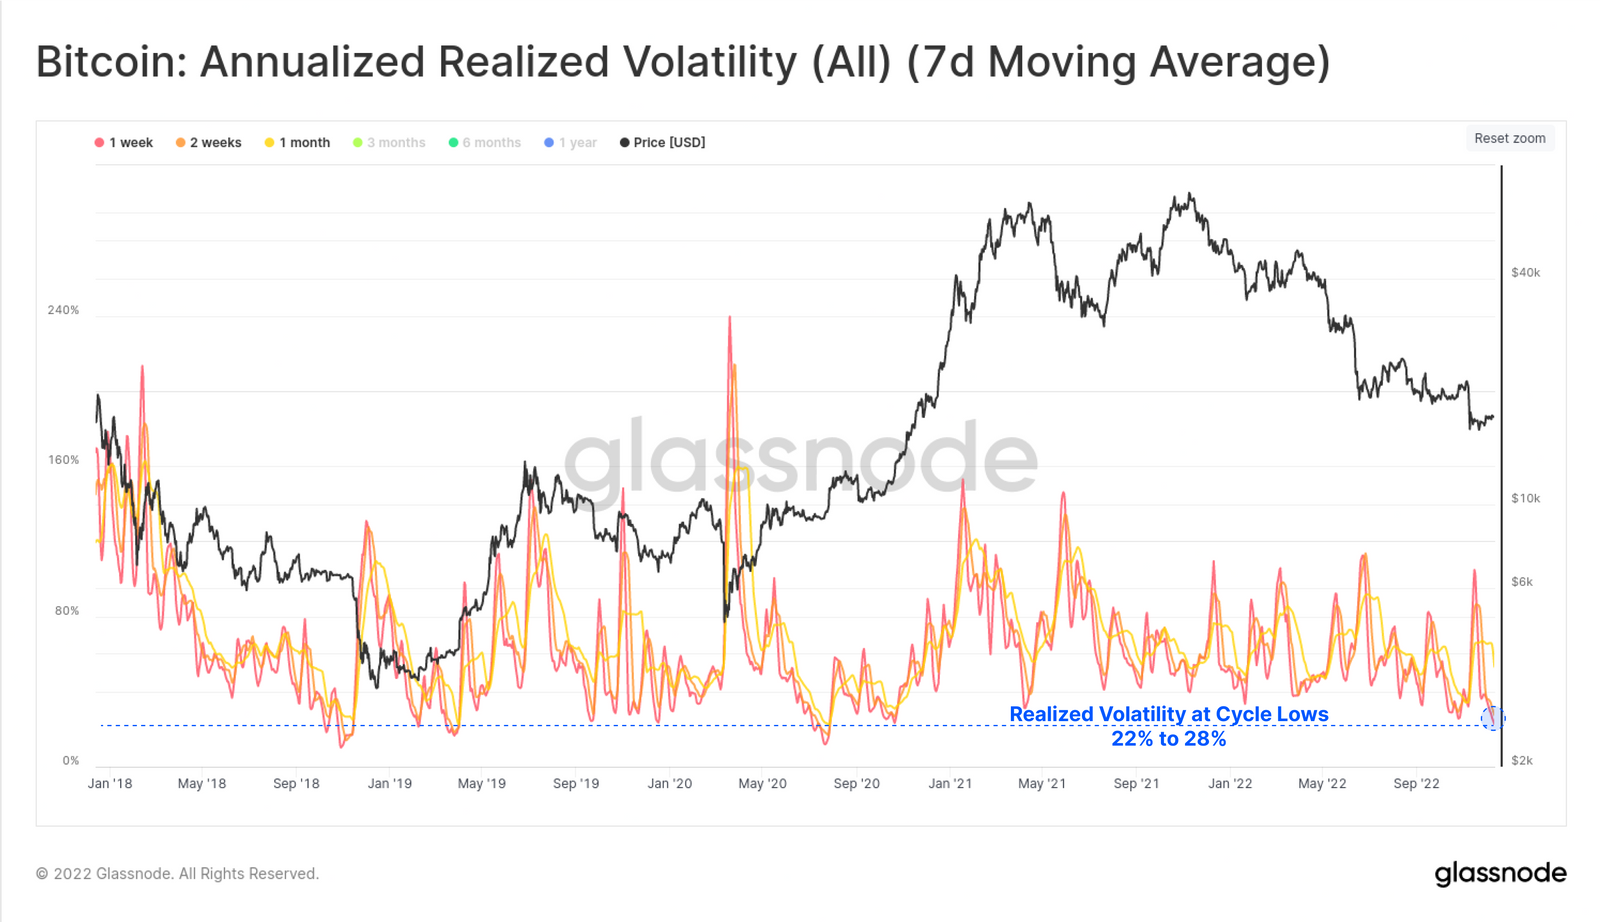
Annualized Realized Volatility
After a truly chaotic year in 2022, the Bitcoin market turned very quiet in December. Short-term realized volatility for BTC trended multi-year lows of 22% (1 week) and 28% (2 weeks), making for the lowest volatility regime since Oct 2020. Historically, times like these fuel periods of increased volatility with steep price movements have been evident in 2023 as prices went up over 40% in four weeks.

Total Supply Held by Long-Term Holders
Despite all the spectacularly large losses, the chaos, and the systemic failures of multiple crypto firms in 2022, long-term holder supply completely reverted the panic spending that happened after the FTX fiasco to hit a new ATH of 13.908 million BTC (72.3% of circulating supply).
This metric’s near linear uptrend reflects the heavy coin accumulation that occurred in June and July 2022, immediately after the deleveraging event inspired by 3AC and failing lenders in the space.
Unrealized Profit and Loss
The ratio between the total unrealized profit and loss held by the market and its yearly average can provide a macro-scale indicator for a recovering market. The recent surge in price action has rallied above several aggregate on-chain cost-basis models, significantly improving the market’s financial position.
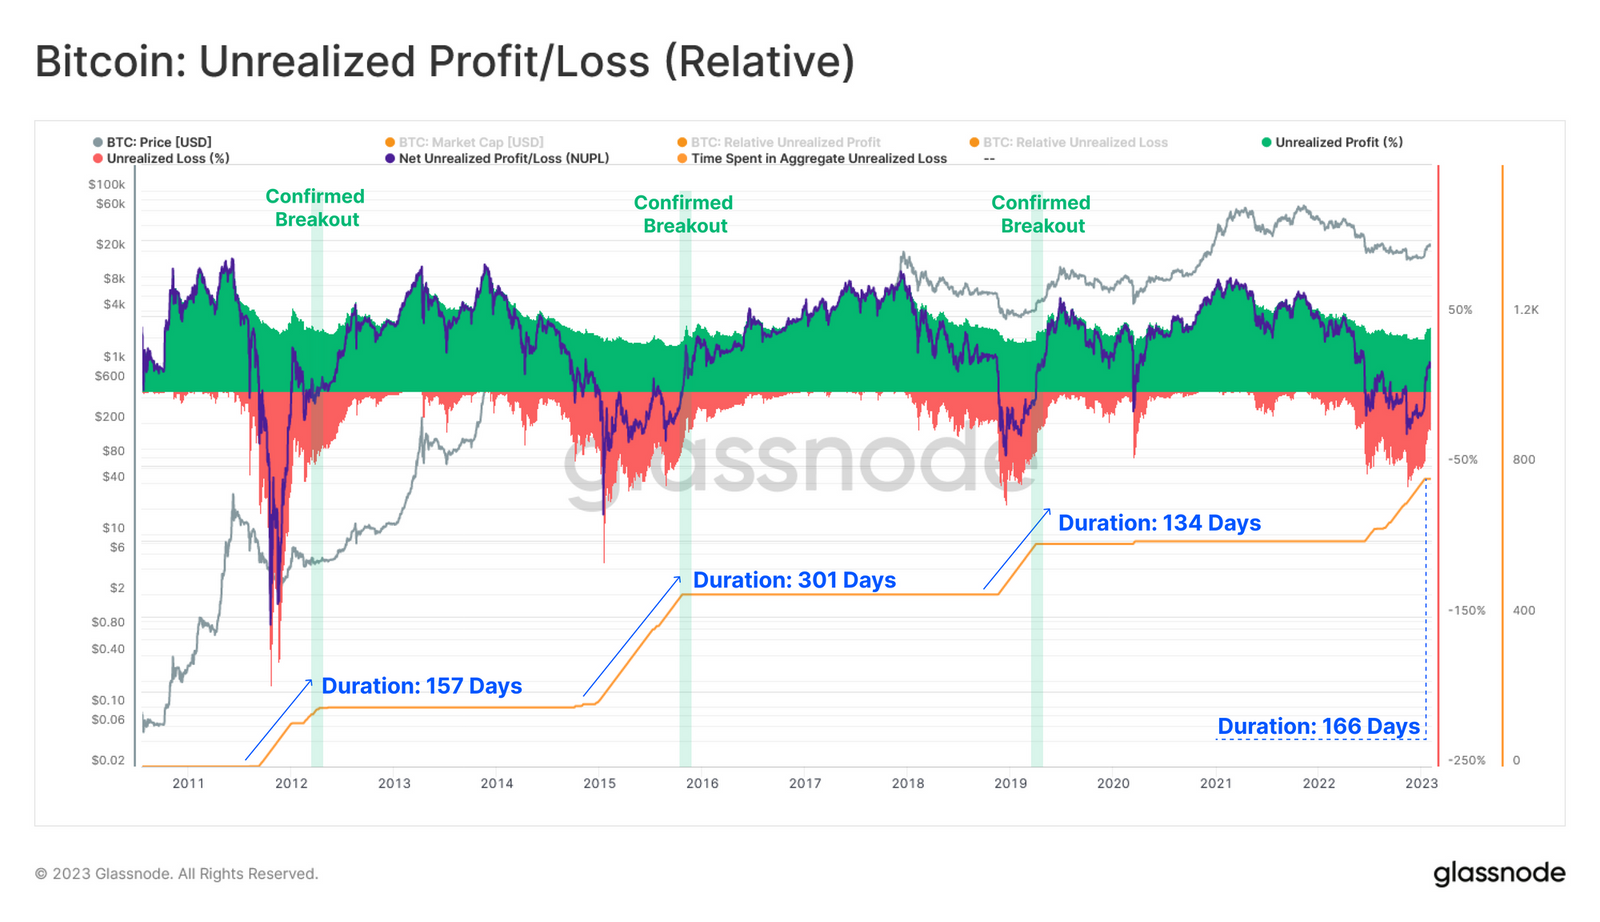
This momentum metric is approaching an equilibrium break point and bears similarity to the recoveries from the 2015 and 2018 bear market years. Confirmed breakouts above this equilibrium point have historically coincided with a transition in the macro market structure. We also note that the time elapsed below this equilibrium point has been similar across major bear markets.
We could also look at a few short-term on-chain indicators to make a bullish case for Q1 2023.
Percent of Short-Term Holder Supply in Profit
When the market is in a prolonged bottom (or top) discovery stage, new investor behavior becomes influential in forming local recovery (or correction) pivot points. We can assess this behavior via the Percentage of Short-Term Holder Supply in Profit.
Interestingly, during bear markets, when greater than 97.5% of the acquired supply by new investors is in loss, the chance of seller exhaustion rises exponentially. Conversely, when greater than 97.5% of short-term holder supply is in profit, these players tend to seize the opportunity and exit at break-even or profit.
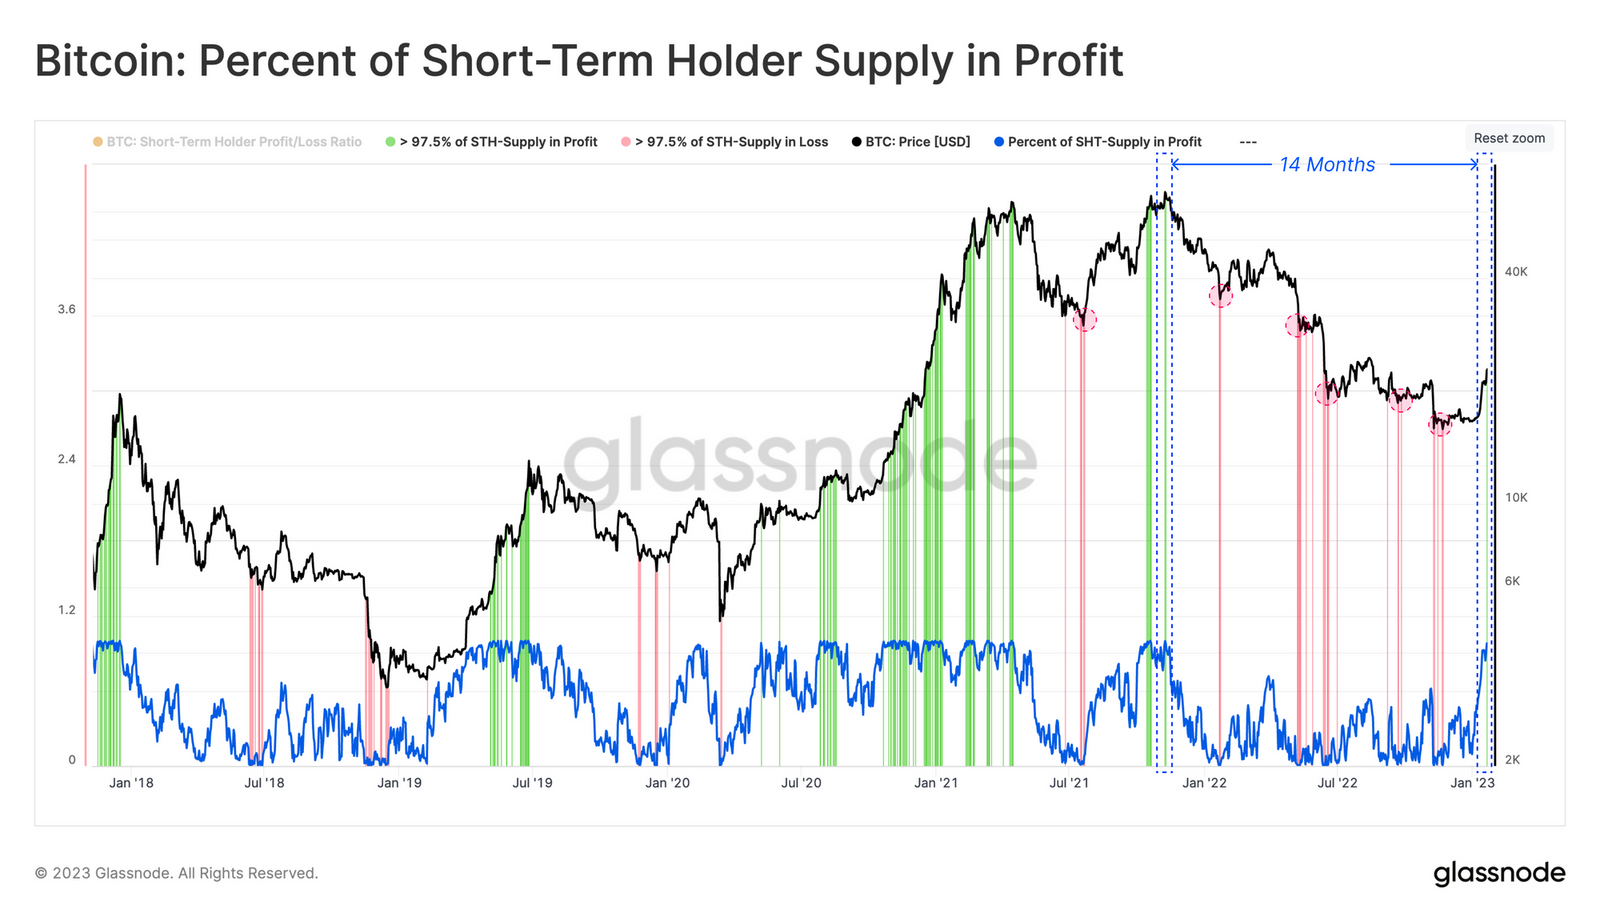
The recent surge to $24,000 has pushed this metric to greater than 98% in profit for the first time since the ATH in November 2021. Given this substantial spike in profitability, the probability of sell pressure sourced from this metric is likely to grow accordingly.
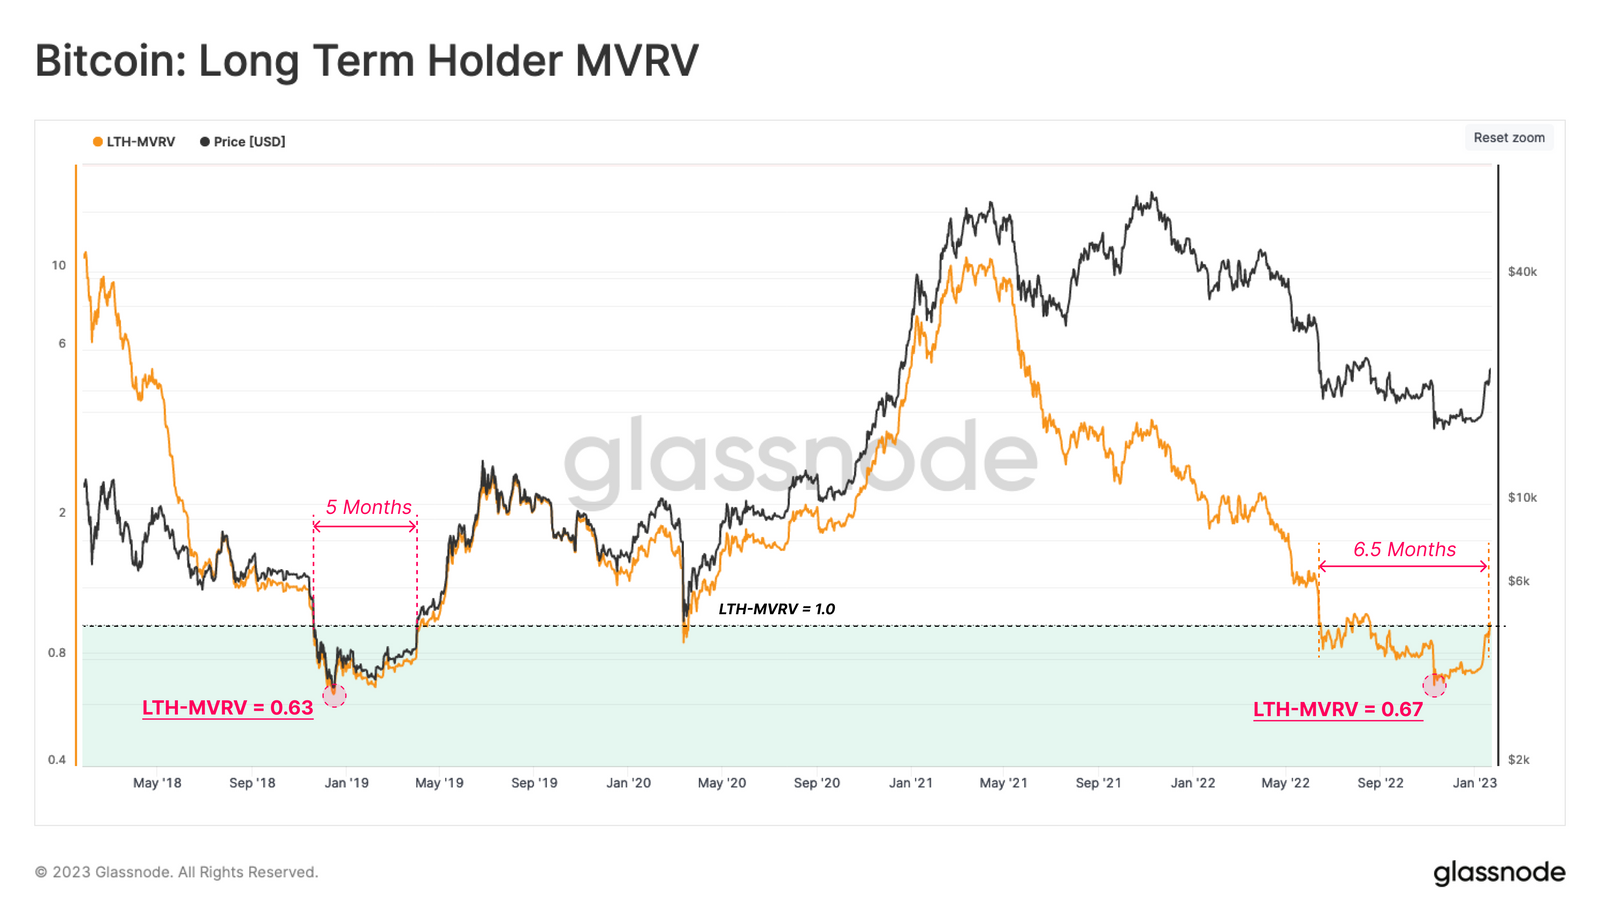
Long-Term Holder Market Value to Realized Value
Assessing the profitability and behavior of short-term holders in isolation does not provide a full-scope assessment of the market. Therefore it is important also to study the behaviors of the long-term holder cohort, many of which are 2021-22 investors that remain overwhelmingly underwater on their holdings.
The LTH-MVRV metric compares the cost-basis of the long-term holder cohort against current spot prices, providing insight into the unrealized profit or loss they hold. At 1, it means long-term holders are at break even. Above 1, they are in profit, while below 1, they are in loss.
Tracing this metric shows that after 6.5 months, the market price has finally recovered above the long-term holders” cost basis at $22,600. That denotes that the average LTH is only just above their break-even basis. A closer look at the week’s lows shows that Bitcoin’s spot price bounced off this area. Long-term holders supporting price, so it does not go below their breakeven?
Considering the time length of LTH-MVRV traded below 1 and the lowest printed value, the ongoing bear market has been very comparable with 2018 – 2019.
All these observations point to a rebound in Bitcoin price that will be sustained through the present year into 2025 post-halving.
Macro Economic Analysis
The United States of America is the financial capital of the world. Most global markets react to what the US, through its apex bank — the Federal Reserve — is or is not doing. January Inflation data came in at 0.3% month-on-month for December, signaling that inflation and chances of a recession were easing. The Fed subsequently hiked 25 basis points a couple of days later, and after that meeting which is also the latest, the Fed Chairman, Jerome Powell, acknowledged that inflationary pressures were easing, and, depending on the data, the Fed may continue to slow down the pace of rate hikes or even pause them altogether. The rate of change of rate hikes is slowing, which, vs. 2022, is a major improvement for market sentiment towards risky assets, including Bitcoin.
Rate hikes are generally bearish for risk assets since they pull US dollar liquidity from the economy, reducing the amount of money going after risk assets. Other variables affect the dollar liquidity conditions, which include; the size of Reverse Repo (RRP) balances held at the New York Federal Reserve and the US Treasury General Account (TGA) also balances with the New York Fed, and these variables are increasingly looking to tilt toward favorable positions for risk assets.
Typically, higher USD liquidity means risk assets thrive, and this is directly proportional to the Fed balance sheet but inversely proportional to TGA and RRP balance. At the current state of things, the Fed’s balance sheet will shrink by $100 billion every month, which is negative for risk. The Treasury will draw down the TGA to zero due to the debt ceiling being hit. The TGA is currently at ~$500 billion and will most likely neutralize the effect of balance sheet shrinking by the Fed. As market conditions continue to improve, investors will most likely take out money from money market funds and invest in equity and risk markets which will hurt the RRP. Overall, this is a good time to tune up one’s risk appetite.
Investor Sentiment
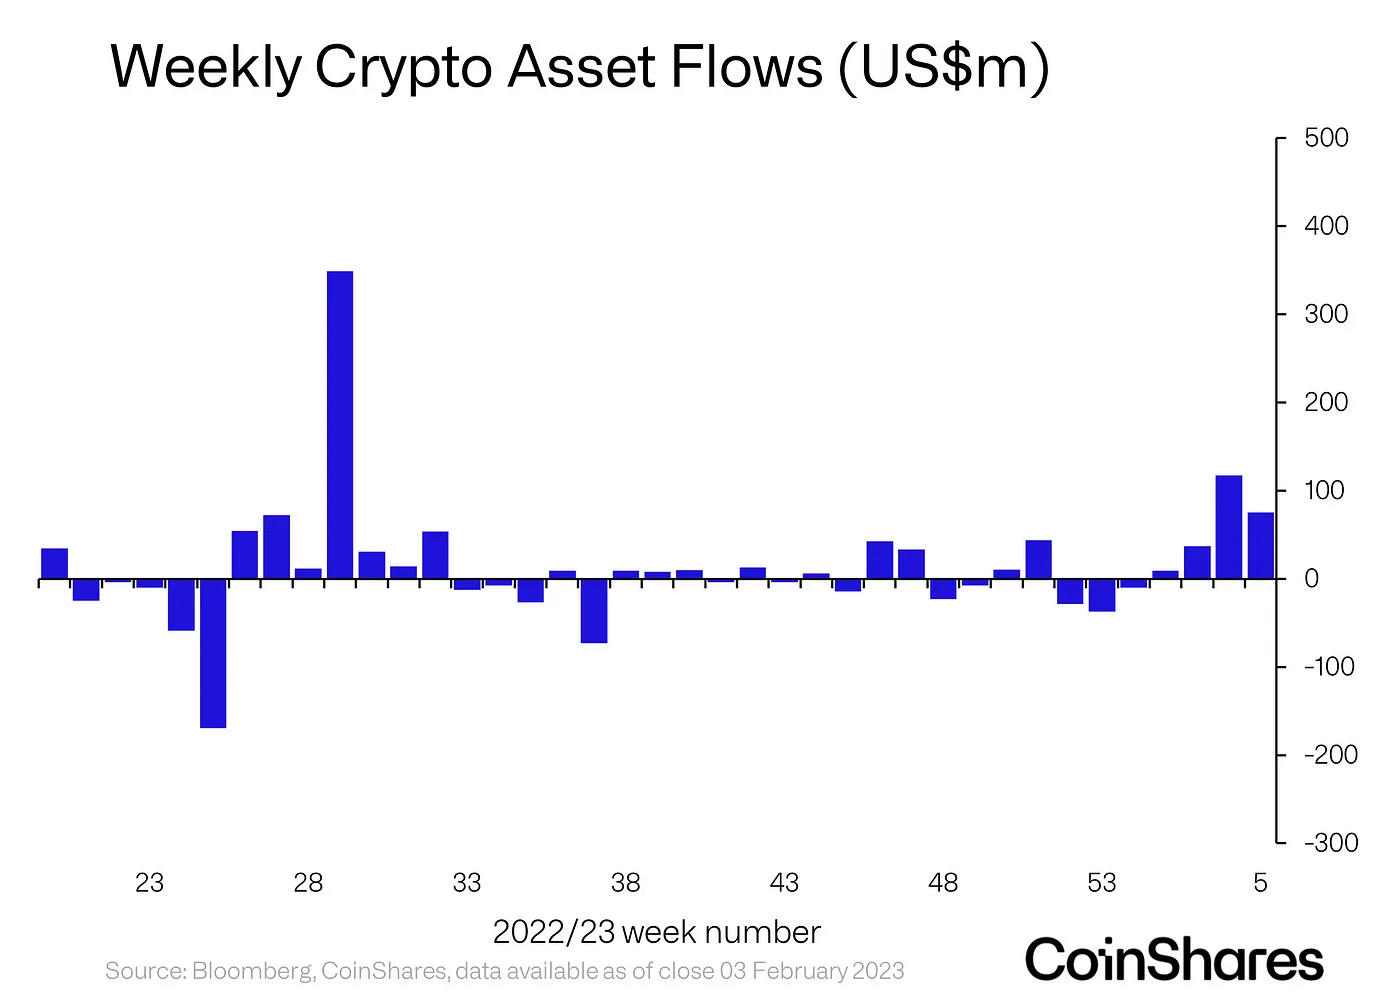
According to Coin Shares, a digital asset investment strategy firm, digital asset investment products saw inflows totaling $76 million last week, the 4th consecutive week of inflows with year-to-date inflows now at $230 million, highlighting a decisive change in investor sentiment for the beginning of 2023. Total investment assets under management (AuM) have risen 39% year-to-date and are now $30.3 billion, the highest since mid-August 2022. Regionally, inflows were focused on the US, Canada, and Germany, with inflows of $38 million, $25 million, and $24 million, respectively.
Bitcoin remains the primary investor focus, with inflows totaling $69 million, representing 90% of the total flows for the week. That indicates how positive the market expectations currently are in predicting the steps the Federal Reserve will take.
Conclusion
Generally, 2023 by many metrics and macro conditions, will be the beginning of the next bull market. The on-chain metrics predict that while the macro conditions corroborate. This bull market will likely expand into 2025, and what a ride patient investors will have during this time.
Interested in marketing your blockchain/Web3 project? Please contact Off-Chain Communications for a free consultation and quote.
If you enjoyed this article, you may also enjoy…
Blockchain Technology is Revolutionizing Africa
Porsche Miscalculates its Leap into Web3
The Importance of Media Relations for Blockchain Startups
Check out the home page of Exploring Digital Assets for additional insights, reports and news!
One thought on “A Closer Look at the Fundamentals Guiding Bitcoin (BTC)”